
One of the trends identified in our two articles of the Canadian Bank’s FY2019 provisions (Part I and Part II) was the y/y increase in Stage 2 migrations, far more significant for National and RBC than the rest of the Big Six banks. Related to this was the variance in the proportion of Stage 2 loans across banks and the variance in the sensitivity of ECL due to staging.
In this article we examine the variance in Stage 2 across banks and products in more detail. The criteria for determining a significant increase in credit risk (SICR) and therefore a Stage 2 migration play a key role in the Stage 2 migrations. For reference purposes we list the SICR criteria as reported by the six banks in the Appendix. All of the banks use different criteria for Retail vs. Non-retail exposures.
Table 1 from Part I presents again the stage mix of total loans for each of the six banks. We note: (i) the aforementioned increase of Stage 2 loans in the mix, more significant for National and RBC, and (ii) Scotia experiencing a drop in Stage 2 loans in FY2019.
- Which products are driving the increase of Stage 2 loans in the mix for National and RBC?
- Is this increase consistent across products?
- What could be driving any differences?
- Similarly for Scotia, is the y/y drop in Stage 2 loans consistent across products?
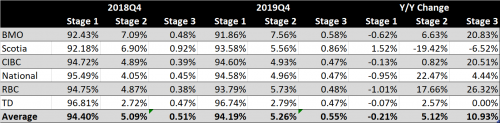
Table 1. Breakdown of Total Loans by IFRS9 Stage
Tables 2-5 show the stage mix for each the four product categories: Residential Mortgages, Consumer (excl. Credit Cards), Credit Cards, Business & Government.
- National had the highest y/y increase in Stage 2 Business & Government and the second highest increase in Stage 2 Consumer. Its increase in Stage 2 Residential Mortgages was relatively small. Stage 2 Credit Cards experienced a slight drop. Hence, National’s increase of total Stage 2 loans was driven by Business & Government and Consumer.
- RBC had the highest y/y increase in Stage 2 Residential Mortgages and Consumer. The increase in Stage 2 for Credit Cards and Business & Government was relatively small. Thus, the increase for RBC was mainly driven by Residential Mortgages and Consumer.
- The drop in Scotia’s Stage 2 loans was mainly driven by Business & Government, at 43% y/y, see Table 5. It was the biggest y/y drop in Stage 2 loans of this product category within the peer group. It was due to a y/y drop of 73% in the Investment grade segment of Stage 2 and a y/y drop of 33% in the Non-Investment grade segment of Stage 2. The respective Stage 1 segments increased.
Given Scotia’s rather more pessimistic y/y scenarios, the latter would not have caused such significant risk improvement for this product category. Because of this drop Scotia moved from having the highest proportion of Stage 2 for this category in FY2018 to one closer to the average in FY2019.
Also, the exposures with 30+ days past due increased by 34% y/y for this product category. Hence, the 30-day backstop was not responsible for this significant shift in risk.
As noted in the Appendix, Scotia determines significant increase in credit risk (SICR) based on the migration of exposures amongst rating codes. The only other bank with a drop in Stage 2 (11% y/y/) for this product category is CIBC. However, CIBC experienced only a 10% y/y drop in the Stage 2 of Non-investment grade loans. For Residential Mortgages and Credit Cards Scotia reported a drop of 2% and 1% respectively, whereas for Consumer an increase of 2%. These are relatively small changes.
Is it possible that Scotia changed the SICR criteria for Business & Government during FY2019 by requiring a bigger rating code downgrade for a SICR to occur?
Let us now examine the variance of the mix within each product category.
- Residential Mortgages: All of the banks except Scotia exhibited a y/y increase in Stage 2 loans, average y/y increase of 10%. Scotia had a small drop but maintained the second highest proportion in the peer group at 4%, below BMO’s at 6.6%. Three out of the six banks reported a y/y increase in Stage 3 loans. These groupwide results indicate a significant rise of credit risk for Residential Mortgages.
TD has been the outlier for Stage 2: 0.8% in FY2018 and 0.9% in FY2019. These proportions are over three times lower than the closest Stage 2 proportions, namely National’s at 2.8% and 2.9% for FY2018 and FY2019 respectively. Although TD has the smallest Stage 2 proportion across all three Retail categories relative to its peers, it shows the biggest difference in Residential Mortgages.
A combination of factors, i.e. scenarios, PD and SICR criteria, could be causing these differences particularly in the case of Residential Mortgages. The 12.5% increase of Stage 2 loans for TD can be partly explained by the 12.2% y/y increase of 30+ delinquencies in its Residential Mortgages. TD had also more pessimistic values for GDP and HPI in its adverse scenario in 2019 than in 2018, although the adverse scenario seems to have little contribution to the ACL and most likely to the expected PD as we saw in Part II of the series. Thus, could TD be using more stringent relative and absolute thresholds for PD in its SICR criteria for Retail exposures relative to its peers?
It is worth pointing out that TD had the biggest y/y increase in Stage 3 loans for Residential Mortgages at 22%. This was over two times the second biggest increase in Stage 3 loans, namely that of CIBC at 9%. In general, maintaining a relatively small proportion of Stage 2 loans could cause a jump in Stage 3 loans when the economy starts deteriorating, hence creating procyclicality in the allowances and provisions. Could this be the case for TD?
- Consumer: Four out of the six banks, including Scotia, reported an increase in Stage 2 loans. Scotia’s y/y increase though was a small one. In fact, this is the only product category for which Scotia registered a y/y increase. Only CIBC showed a y/y increase in Stage 3 loans. The groupwide results indicate the start of a credit cycle for Consumer.
- Credit Cards: Only two out of the six banks, TD and RBC, showed an increase in Stage 2 loans. Although Scotia had a small drop in Stage 2, it has maintained the highest proportion of Stage 2 in the group, at 20%. CIBC reported a y/y drop of 42.5% in Stage 2 credit cards. We do not know what could have caused such significant drop other than that the drop in Stage 2 came from the low and medium risk segments of CIBC’s credit card portfolio. At the same time its 30+ delinquencies increased y/y, albeit only slightly by 1.5%. The groupwide results do not indicate any increase in credit risk for Credit Cards.
TD is again the outlier for Stage 2 credit cards. However, this is partly due to the fact that TD is using a different impairment definition for credit cards than its peers, namely it declares a credit card as impaired (Stage 3) when it is 90 days or more past due. Its peers use 180 days past due for this product category. For this reason TD also has the highest proportion of Stage 3 credit cards as it is migrating credit cards into the impairment status much sooner than the other banks.
- Business & Government: Four out of the six banks exhibited a y/y increase in Stage 2 loans and five out of six an increase in Stage 3 loans. In fact, all of the Stage 3 increases were double digit, with an average increase of 18%. Thus, this product category together with residential mortgages caused the rise in provisions for these banks.
Some of the impairments in this product category were reported as due to fraud. Nevertheless, such double digit growth for Stage 3 raises questions about the forecasting power of the respective PDs and/or the effectiveness of the SICR criteria. The groupwide results indicate heightened risk for this product category.
The above trends are also reflected in the comparison of the total ACL coverage ratio in Table 6. The ACL coverage ratio has remained relatively stable for Retail, whereas it has declined for Business & Government for all banks except BMO. The latter has also had the highest Stage 2 proportion for this product category. The significant variance of the coverage ratio for Business & Government reflects the different level of conservatism amongst banks.
Concluding remarks
- National’s increase of total Stage 2 loans was driven by Business & Government and Consumer. The increase for RBC was mainly driven by Residential Mortgages and Consumer.
- The drop in Scotia’s Stage 2 loans was mainly driven by Business & Government at 43% y/y, a very significant drop in its investment and non-investment grade segments. This is despite an increase in the 30+ delinquencies. A revision of its SICR criteria for this product category might be the cause.
- The increase in total Stage 2 loans differs by product and bank. On average, Consumer had the highest increase in Stage 2 from all products: three out of six banks had a y/y increase between 29-42%. Residential Mortgages had the second highest: four out of six banks had an increase between 11-25%.
- TD has been the outlier for Stage 2 loans, particularly in Residential Mortgages. For the latter it reported the biggest y/y increase in Stage 3 loans. We analyzed a few possible causes for this pattern. Nevertheless, maintaining a relatively small proportion of Stage 2 loans may cause a jump in Stage 3 loans when the economy starts deteriorating, hence creating procyclicality in the allowances and provisions.
- In Residential Mortgages, all of the banks except Scotia exhibited a y/y increase in Stage 2 loans and three out of the six banks reported a y/y increase in Stage 3 loans. In Consumer, four out of the six banks reported an increase in Stage 2 loans. Only one bank showed a y/y increase in Stage 3 loans. In Business & Government, four out of the six banks exhibited a y/y increase in Stage 2 loans and five out of six an increase in Stage 3 loans. All of the Stage 3 increases were double digit.
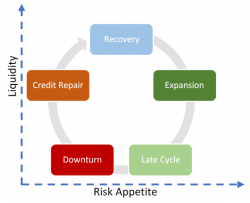
- Based on the groupwide results in (5), Consumer, Residential Mortgages and Business & Government could be at the start of the credit cycle for these asset classes, with the last two being at a bit more advanced stage.
- The ACL coverage ratio has remained relatively stable for Retail whereas it has declined for Business & Government. The significant variance of the coverage ratio for Business & Government reflects the different level of conservatism amongst banks.
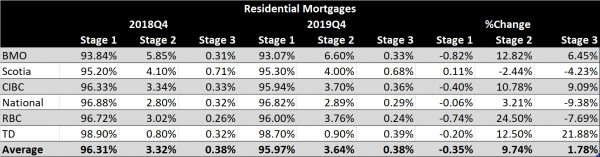
Table 2. Residential Mortgages Mix by IFRS9 Stage
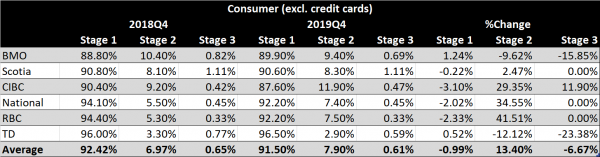
Table 3. Consumer (excl. credit cards) Mix by IFRS9 Stage
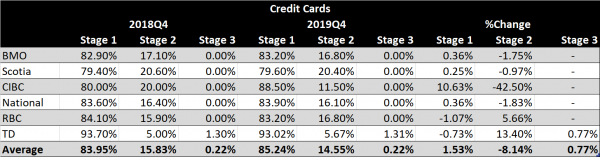
Table 4. Credit Cards Mix by IFRS9 Stage
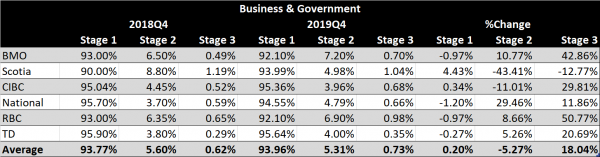
Table 5. Business & Government Mix by IFRS9 Stage
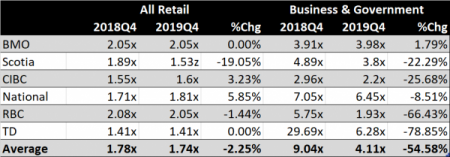
Table 6. Total ACL Coverage as a proportion of impaired provisions in last 12 months
Appendix. SICR for the Big 6 Banks
BMO
The determination of a significant increase in credit risk takes into account many different factors and varies by product and risk segment. The main factors considered in making this determination are relative changes in probability-weighted probability of default (“PD”) since origination and certain other criteria, such as 30-day past due and watchlist status.
Scotia
Retail portfolio – For retail exposures, a significant increase in credit risk cannot be assessed using forward looking information at an individual account level. Therefore, the assessment must be done at the segment level. Segment migration thresholds exist for each PD model by product which considers the proportionate change in PD as well as the absolute change in PD. The thresholds used for PD migration are reviewed and assessed at least annually, unless there is a significant change in credit risk management practices in which case the review is brought forward.
Non-retail portfolio – The Bank uses a risk rating scale (IG codes) for its non-retail exposures. All non-retail exposures have an IG code assigned that reflects the probability of default of the borrower. Both borrower specific and non-borrower specific (i.e. macroeconomic) forward looking information is considered and reflected in the IG rating. Significant increase in credit risk is evaluated based on the migration of the exposures among IG codes.
CIBC
For the majority of our retail loan portfolios, we determine a significant increase in credit risk based on relative changes in the loan’s lifetime PD since its initial recognition. The PDs used for this purpose are the expected value of our upside, downside and base case lifetime PDs. Significant judgment is involved in determining the upside, downside and base case lifetime PDs through the incorporation of forward-looking information into long run PDs, in determining the probability weightings of the scenarios, and in determining the relative change in PDs that are indicative of a significant increase in credit risk for our various retail products. Increases in the expected PDs or decreases in the thresholds for changes in PDs that are indicative of a significant increase in credit risk can cause significant migration of loans from stage 1 to stage 2, which in turn can cause a significant increase in the amount of ECL allowances recognized. In contrast, decreases in the expected PDs or increases in the thresholds for changes in PDs that are indicative of a significant increase in credit risk can cause significant migration of loans from stage 2 to stage 1.
For the majority of our business and government loan portfolios, we determine a significant increase in credit risk based on relative changes in internal risk ratings since initial recognition. Significant judgment is involved in the determination of the internal risk ratings. Deterioration or improvement in the risk ratings or adjustments to the risk rating downgrade thresholds used to determine a significant increase in credit risk can cause significant migration of loans and securities between stage 1 and stage 2, which in turn can have a significant impact on the amount of ECL allowances recognized.
While potentially significant to the level of ECL allowances recognized, the thresholds for changes in PDs that are indicative of a significant increase in credit risk for our retail portfolios and the risk rating downgrade thresholds used to determine a significant increase in credit risk for our business and government loan portfolios are not expected to change frequently.
All loans on which repayment of principal or payment of interest is contractually 30 days in arrears and all business and government loans that have migrated to the watch list are automatically migrated to stage 2 from stage 1.
National
At each reporting period, the Bank determines whether credit risk has increased significantly since initial recognition by examining the change in the risk of default occurring over the remaining life of the financial instrument. First, the Bank compares the point-in-time forward-looking remaining lifetime PD at the reporting date with the expected point-in-time forward-looking remaining lifetime PD established at initial recognition. Based on this comparison, the Bank determines whether the loan has deteriorated when compared to the initial conditions. Because the comparison includes an adjustment based on origination-date forward-looking information and reporting-date forward-looking information, the deterioration may be caused by the following factors: (i) deterioration of the economic outlook used in the forward-looking assessment; (ii) deterioration of the borrower’s conditions (payment defaults, worsening financial ratios, etc.); or (iii) a combination of both factors. The quantitative criteria used to determine a significant increase in credit risk are a series of relative and absolute thresholds, and a backstop is also applied. All financial instruments that are over 30 days past due but below 90 days past due are migrated to Stage 2, even if the other criteria do not indicate a significant increase in credit risk.
RBC
Our assessment of significant increases in credit risk is performed at least quarterly based on three factors. If any of the following factors indicates that a significant increase in credit risk has occurred, the instrument is moved from Stage 1 to Stage 2:
- We have established thresholds for significant increases in credit risk based on both a percentage and absolute change in lifetime PD relative to initial recognition. For our wholesale portfolio, a decrease in the borrower’s risk rating is also required to determine that credit risk has increased significantly.
- Additional qualitative reviews are performed to assess the staging results and make adjustments, as necessary, to better reflect the positions whose credit risk has increased significantly.
- Instruments which are 30 days past due are generally considered to have experienced a significant increase in credit risk, even if our other metrics do not indicate that a significant increase in credit risk has occurred.
The thresholds for movement between Stage 1 and Stage 2 are symmetrical. After a financial asset has transferred to Stage 2, if its credit risk is no longer considered to have significantly increased relative to its initial recognition, the financial asset will move back to Stage 1.
TD
For retail exposures, criteria for assessing significant increase in credit risk are defined at the appropriate product or portfolio level and vary based on the exposure’s credit risk at origination. The criteria include relative changes in PD, absolute PD backstop, and delinquency backstop when contractual payments are more than 30 days past due. Credit risk has increased significantly since initial recognition when one of the criteria is met.
For non-retail exposures, BRR is determined on an individual borrower basis using industry and sector-specific credit risk models that are based on historical data. Current and forward-looking information that is specific to the borrower, industry, and sector is considered based on expert credit judgment. Criteria for assessing significant increase in credit risk are defined at the appropriate segmentation level and vary based on the BRR of the exposure at origination. Criteria include relative changes in BRR, absolute BRR backstop, and delinquency backstop when contractual payments are more than 30 days past due. Credit risk has increased significantly since initial recognition when one of the criteria is met.